
Astronomy Object of the Month: 2020, April
< previous Archive next >
A systematic study of microvariability in total flux and polarization in optical band for blazar sources
Active Galactic Nuclei (AGNs) consists of galaxies with extremely bright nucleus, so much so, that they usually outshine the light
from other galaxy parts such as arms or bulges. The reason behind intense power of AGN is believed to be that at the centre of
galaxy a super massive black hole (SMBH) is accreting matter from its vicinity, known as the accretion disk. Sometimes, such
systems are known to erupt powerful, narrow beam of high velocity charged particles. If one happens to view such a systems along
the line of sight of these eruptions (jets) are called blazars. The emission from blazar jets is Doppler boosted, leading to extreme
luminosities and flux variability and apparent superluminal motion shown by the ejecta. Not only such systems show extreme
luminosities, it also varies on all observable timescales ranging from years to minutes with amount of energy dissipated equal to
a million Suns in few hours timescale. The variability of continuum emission is a basic tool for constraining the energy dissipation
processes since it gives information on the size of the emission region. Variability on hourly timescales indicate spatial regions
of the size of 1014 cm, meaning that the emission is generated very close to the jet base. In this study, we report the
results of our multi-band total flux and polarization observation campaign involving many moderate size telescopes located in Poland,
Turkey, Russia, India and Japan.
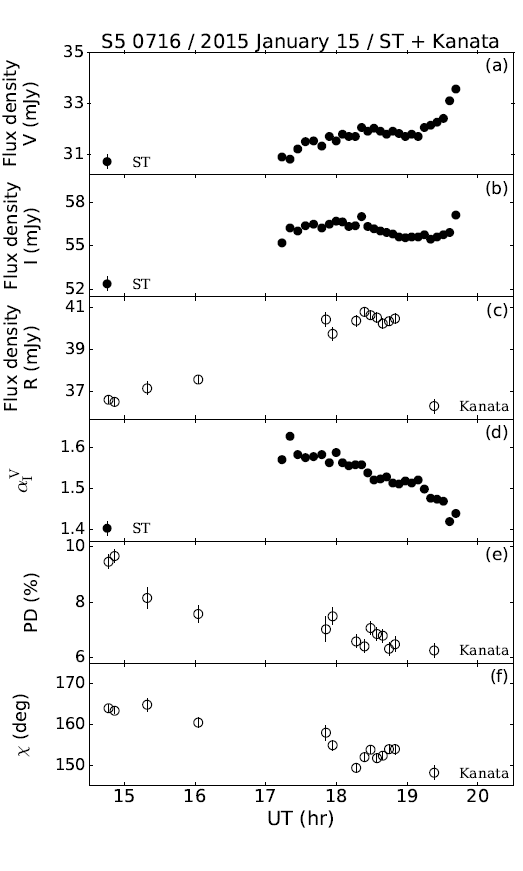 Illustration 1: An example of short-term differential light curve
together with the evolution of the color and polarization for one of the most variable blazars, S5 0716+714 Credit: M. Pasierb et al.
Illustration 1: An example of short-term differential light curve
together with the evolution of the color and polarization for one of the most variable blazars, S5 0716+714 Credit: M. Pasierb et al.
The blazar emission which extends up to 17 decades in frequency consist of two broad peaks (radio to optical and optical to TeV gamma-rays). The two main models of blazar emission suggests that either the leptonic processes (electron—positron particles) or the hadronic processes (protons and other secondary particles) are at work. Within the leptonic scenario, the first peak is due to synchrotron process (accelerated charged particles radiating in the presence of magnetic field) while the second peak could be due to inverse Comptonization of the synchrotron photons.
However, the second peak could also be generated by hadronic processes in the blazar jet. The observed emission is characterized by strong variability at all wavelengths and in time scales ranging from minutes to decades. As the charged particles radiate, they also cool and some time move out of the emission zone which produce specific signatures in the spectra. Because in optical band, the emission is due to the synchrotron process, the examination of polarization puts yet another constraint on the underlying conditions of the emission zone.
Emission by either the leptonic or the hadronic process needs particles to be accelerated to very high energies (tera to peta electronvolts) which requires more accurate knowledge, among others about the structure of the magnetic field that seems to be embedded in the jet and plays a key role in its expansion. Obtaining observations providing information on both the evolution of the flux as well as on the degree and orientation of the polarization vector, is thus extremely important here.
In this work, a selected sample of 8 blazars bright in the optical range was analyzed. Photometric observations collected by terrestrial optical telescopes located in Poland, India and Turkey (in at least two filters, which allowed to determine the spectral index at a later stage), as well as polarimetric data from separate instruments - from Japan and Russia - were used. Due to unpredictable and very variable weather conditions, obtaining good quality and overlapping photometric and polarimetric observations has always been a big challenge. In this case, however, several such simultaneous observations were obtained.
Our results indicate statistically significant flux density, color and polarization (both in degree and vector) microvariability on several occasions. The estimated duty cycle of flux density microvariability is ~ 40% (this is the ratio of the number of observations during which the source showed statistically confirmed variability to the number of all observations in a given filter). The color microvariabilty duty cycle is ~50% for our observation; reported for the first time for blazar sources.
The study examined the existence of all possible correlations in the spaces defined by flux density, spectral index, degree of polarization, and polarization angle. The flux density does not show a preferred spectral index state. The results of these comparisons and the large variety of trends observed in the flux-degree of polarization or flux-spectral index planes indicate the very complex nature of processes responsible for microvariability in blazar sources. Its nature can be approximated by adopting the appropriate emission model, nevertheless this choice is often not clear.
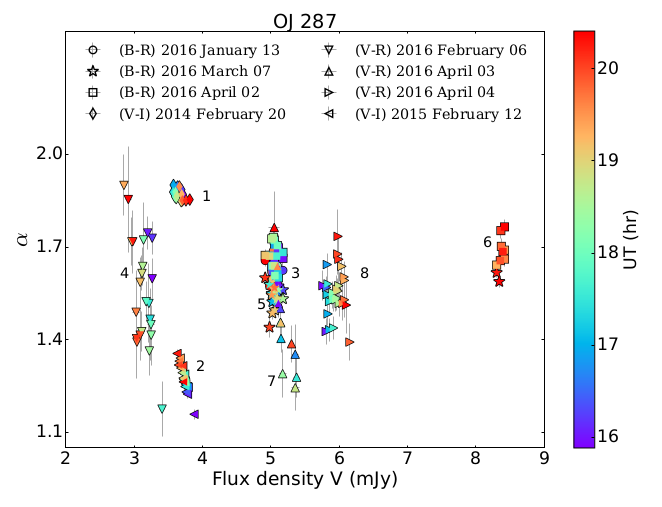 Illustration 2: Evolution of spectral indexes as a function of flux measured in V filter for blazer OJ 287 (composition of 8 data lasting several hours collected between February 2014 and April 2016). Credit: M. Pasierb et al.
Original publication: M. Pasierb et al. Multiband optical flux density and polarization microvariability study of optically bright blazars, MNRAS, 2020.
The research was conducted at the High Energy Astrophysics Department and the Department of Stellar and Extragalactic Astronomy of the Jagiellonian University Astronomical Observatory. The work was supported by the Polish National Science Centre (NCN) through the grants: 2018/29/B/ST9/02298, 2016/22/E/ST9/00061 and 2018/29/B/ST9/01793.
|
Magdalena Pasierb Astronomical Observatory Jagiellonian University M.Pasierb [at] oa.uj.edu.pl |
