
Astronomy Object of the Month: 2023, October
< previous Archive next >
What do halo CMEs tell us about Solar Cycle 25?
The Sun affects the Earth’s environment in a variety of ways and different time scales. It powers life on Earth,
therefore any changes in the radiative output of the Sun may affect the energy balance on our planet. Satellite
observations over the past 40 years have shown that long and short-term variations in solar activity cause small
changes to the Sun's energy output (solar irradiance), less than 0.1%. Solar irradiance changes of this magnitude
have no significant effect on our climate. However currently, the Sun experiences a decline in activity. This may
mean that the Sun enters a long period of low activity, a modern grand minimum.

Illustration: Active Sun – 01.10.2023, Solar Dynamic Observatory. Credit: SpaceWeather / SDO.
Recently, such a period in solar activity was observed in the 17th century. During the Maunder Minimum, the solar irradiance went down by 0.22%. This caused the average temperature to drop by 1-1.5 degrees Celsius and led to frozen rivers, long cold winters, and cold summers. The solar activity reflects solar dynamic processes which are nonlinear. Therefore, a connection between all the physical phenomena on the Sun is very complex. Predicting even the most noticeable processes such as cyclical events (11-year cycles of solar magnetic activity) is subject to great uncertainty.
There are many methods of predicting subsequent cycles of solar activity. Current predictions for the strength of solar cycle (SC) 25 range from half to twice the strength of SC 24. In the presented research, we used a new approach to estimate the intensity of the 25th cycle of solar activity. For this purpose, we compare the halo coronal mass ejections (HCME) occurrence rate and other properties during the rise phase of cycles 23, 24, and 25. The HCME, in coronagraphic observations (observations of the solar corona with the obstructed solar disk), appears as a brightness around the entire occulting disk. To appear as halos, CMEs need to originate close to the central meridian either in the front side or the backside of the Sun as viewed from the Earth. Thus, a front side halo CME observed from the Sun–Earth line has a high probability of impacting Earth and causing geomagnetic storms.
The SOHO satellite observations of CMEs in SC 24 indicated that there is something peculiar about the HCME occurrence rate when compared with that in SC 23. The number of HCMEs in SC 24 was similar to SC23 while the sunspot number (SSN) decreased by more than 40% (magnetic intensity of SC 24 decreased by 40%). The higher abundance of halos in SC 24 (normalized to SSN) was found to be an indicator of the week state of the heliosphere after the long and deep minimum of solar activity between cycles 23 and 24. The reduced pressure in the heliosphere made CMEs expand more so they became halos even while originating from larger distances from the center of the Sun. Furthermore, in SC 24 CMEs became halos sooner (closer to the Sun) and at a lower speed than the SC 23 ones. These results suggest that it is possible to infer the relative strength of a solar cycle based on the occurrence rate of HCMEs. Result of these considerations are presented in Figure 1.
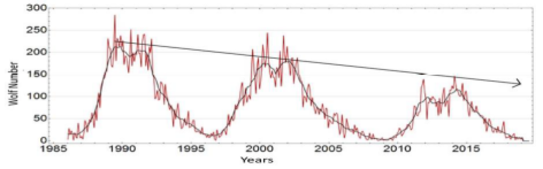
Figure 1: Wolf number for cycles 22-24. The red line represents monthly averages
sunspot number while the black line reflects the 13-month smoothed average sunspot number. Credit: Smolark, K., Michałek, G., The
last two solar cycles 23 and 24, 277, Annales Astronomia Novae, vol 2, 277, 2021.
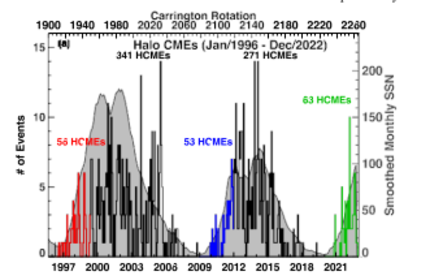
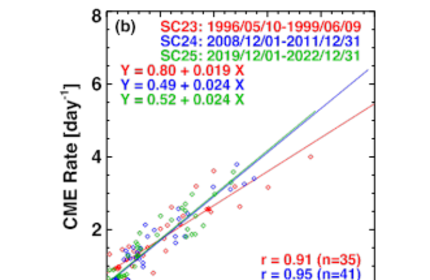
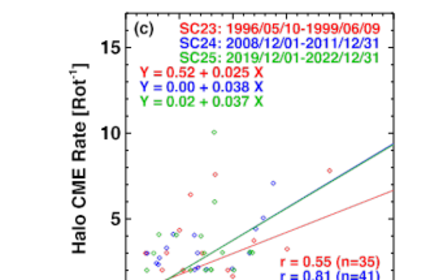
Figure 2: (a) The number of HCMEs summed over Carrington rotation (CR) periods
plotted as a function of time since the beginning of 1996. The 13 month smoothed monthly SSN is shown in gray for reference. The rise
phases of SCs 23, 24, and 25 are distinguished by the red, blue, and green segments of the plot. (b) Scatterplot between CME daily
rate averaged over CR periods and the sunspot number (v2) for the rise phase of three SCs: 23 (red), 24 (blue), and 25 (green). (c)
Scatterplot between the SSN and HCME occurrence rate (per CR). The number of data points in SC 23 is smaller because we dropped six CRs
that had less than 50% duty cycle due to SOHO data gap. All the correlation coefficients in the plots exceed the Pearson’s critical
coefficients: for 35 and 41 samples are 0.53 and 0.50, respectively, 4 with the chance-coincidence probability < 5 × 10⁻⁴.
Credit: Gopalswamy et al. 2023.
From the figures we see that:
- The numbers of HCMEs in SCs 23, 24, and 25 during the rise phase are approximately the same, although the average SSN is substantially lower in SCs 24 and 25,
- The CME rate—SSN correlation is strong for the general population of CMEs and HCMEs in the rise phase,
- In most aspects that compare SCs 23–25, SC 25 is intermediate between SCs 23 and 24 (Figure 2, (b) and (c), but closer to SC 24, confirming that SC 25 is similar to or only slightly stronger than SC 24, but significantly smaller than SC 23. This result means that the sun will likely continue the trend observed in cycle 24, i.e. a significant decline in solar activity.
Original publication:
Nat Gopalswamy, Grzegorz Michałek, Seiji Yashir et al., What Do Halo CMEs Tell Us about Solar Cycle 25?, The Astrophysical Journal Letters, 952, 1 (2023)
The research was conducted at the Department of High Energy Astrophysics of the Jagiellonian University’s Astronomical Observatory (OA UJ).
Contact:
From the figures we see that:
- The numbers of HCMEs in SCs 23, 24, and 25 during the rise phase are approximately the same, although the average SSN is substantially lower in SCs 24 and 25,
- The CME rate—SSN correlation is strong for the general population of CMEs and HCMEs in the rise phase,
- In most aspects that compare SCs 23–25, SC 25 is intermediate between SCs 23 and 24 (Figure 2, (b) and (c), but closer to SC 24, confirming that SC 25 is similar to or only slightly stronger than SC 24, but significantly smaller than SC 23. This result means that the sun will likely continue the trend observed in cycle 24, i.e. a significant decline in solar activity.
Original publication:
Nat Gopalswamy, Grzegorz Michałek, Seiji Yashir et al., What Do Halo CMEs Tell Us about Solar Cycle 25?, The Astrophysical Journal Letters, 952, 1 (2023)
The research was conducted at the Department of High Energy Astrophysics of the Jagiellonian University’s Astronomical Observatory (OA UJ).
|
Grzegorz Michałek Astronomical Observatory Jagiellonian University G.Michalek [@] oa.uj.edu.pl |
