Antennae - the best example of colliding galaxies
 Antennae: the optical picture by David Malin and contours of total power
emission at 3.6 cm. Note a strong radio emission just in the region between
the galaxies and a polarized radio tail following the optical one. The image is
made from the VLA D-array data gathered by E. Hummel. The vectors are of
polarized intensity at this frequency.
Antennae: the optical picture by David Malin and contours of total power
emission at 3.6 cm. Note a strong radio emission just in the region between
the galaxies and a polarized radio tail following the optical one. The image is
made from the VLA D-array data gathered by E. Hummel. The vectors are of
polarized intensity at this frequency.
 A high resolution view of the Antennae made using the VLA C-array 6 cm data by
E. Hummel. Circles mark the centers of colliding galaxies. The region of a
hidden star-formation burst is marked by "+".
A high resolution view of the Antennae made using the VLA C-array 6 cm data by
E. Hummel. Circles mark the centers of colliding galaxies. The region of a
hidden star-formation burst is marked by "+".
 The spectral index map (a power-law fit using the VLA data at 20 (C-array), 6
and 3.6 cm (D-array)). Note a dramatic steepening of the radio spectrum in the
SE appendage of the galaxy. It marks the ageing CR electron population being
pulled away from the galaxy.
The spectral index map (a power-law fit using the VLA data at 20 (C-array), 6
and 3.6 cm (D-array)). Note a dramatic steepening of the radio spectrum in the
SE appendage of the galaxy. It marks the ageing CR electron population being
pulled away from the galaxy.
 The cross-sections along the SE tail of various species, like the total power
and polarized intensity, as well as, the polarization degree and the spectral
index. Note:
The cross-sections along the SE tail of various species, like the total power
and polarized intensity, as well as, the polarization degree and the spectral
index. Note:
- A strong steepening of the radio spectrum as we move away from the star-forming disk.
- An increase of the polarization degree in the same direction.
All this may mean:
- An ageing population of CR electrons as they are pulled away from their sources in the disk along the tidal tail.
- A decaying random magnetic field component as it is carried away from turbulent SF regions.
 The contours of thermal emission (caused by a free-free emission from an
ionized gas) overlaid upon the Hα image. Note a strong maximum of a thermal
emission, not seen in the Hα emission. This indicates an existence of a
strongly star-forming region hidden in a thick dust layer.
The contours of thermal emission (caused by a free-free emission from an
ionized gas) overlaid upon the Hα image. Note a strong maximum of a thermal
emission, not seen in the Hα emission. This indicates an existence of a
strongly star-forming region hidden in a thick dust layer.
 The contours of a nonthermal emission (caused by relativistic electrons in a
magnetic field) overlaid upon the Hα image. Note a strong maximum of a
nonthermal emission, similar to that in a thermal one, not seen in the Hα
emission.
The contours of a nonthermal emission (caused by relativistic electrons in a
magnetic field) overlaid upon the Hα image. Note a strong maximum of a
nonthermal emission, similar to that in a thermal one, not seen in the Hα
emission.
This is an attempt to visualize the interrelation between the thermal and nonthermal emission: for some reason it doesn't work??? at the moment.
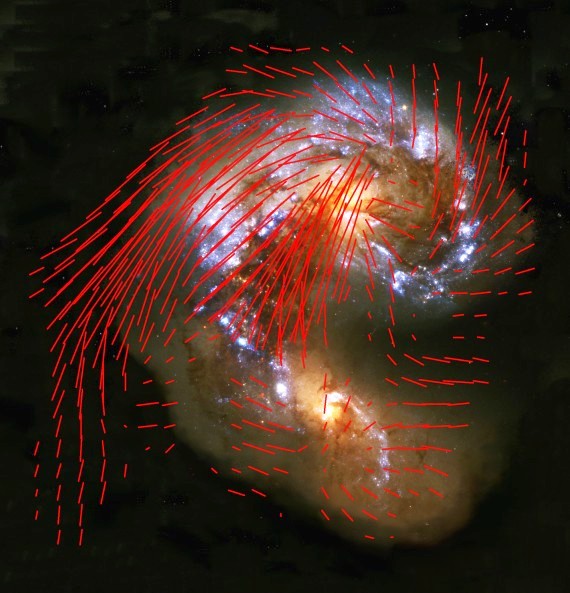 The case of magnetic fields: the vectors depict the polarized intensity (hence
the strength of regular magnetic fields). They are found to be strongest:
The case of magnetic fields: the vectors depict the polarized intensity (hence
the strength of regular magnetic fields). They are found to be strongest:
- in the interface between the galaxies (compression???),
- in the NE outskirt of the galaxy: the basement of the gas outflow tail???.
 This is an overlay of the contours of polarized intensity and B-vectors
proportional to polarization degree upon the Digital Sky Survey image (in
blue). Note that regions of most ordered magnetic fields (highest polarization
degree) are located in the NE outskirts of the galaxy, where strong shear
effects and/or magnetic field pull-out effects may take place! All the details
are at Chyży & Beck 2004.
This is an overlay of the contours of polarized intensity and B-vectors
proportional to polarization degree upon the Digital Sky Survey image (in
blue). Note that regions of most ordered magnetic fields (highest polarization
degree) are located in the NE outskirts of the galaxy, where strong shear
effects and/or magnetic field pull-out effects may take place! All the details
are at Chyży & Beck 2004.